India: 10 major Nifty/Sensex market crashes or corrections, 2016–2026

| # | Period / event | Nifty peak | Nifty bottom | Fall | Main reason | Recovery to previous peak |
|---|---|---|---|---|---|---|
| 1 | COVID-19 crash, 2020 | 12,430 (Jan 2020) | 7,511 (Mar 2020) | −39.6% | COVID-19 pandemic, lockdowns and global economic shock | ~246 days |
| 2 | 2026 correction | 26,329 (Jan 2026) | ~18,900 (Mar 2026) | ~−28% | Global risk-off conditions, geopolitical/economic uncertainty and changing rate expectations | Not fully recovered at the time of the cited data |
| 3 | 2021–23 bear-market cycle | 18,604 (Oct 2021) | ~15,183 (Jun 2022)* | ~−18% | Inflation, rate hikes, Russia–Ukraine war and global tightening | Recovery subsequently occurred |
| 4 | 2018 bear market | 11,760 (Jan 2018) | ~9,998 (Oct 2018) | ~−15% | Oil-price rise, rupee weakness, NBFC/IL&FS stress and global volatility | ~8 months |
| 5 | 2024–25 correction | 26,277 (Sep 2024) | ~21,964 (Feb 2025) | ~−16% | Foreign selling, slowing earnings/growth, high valuations and global trade uncertainty | Recovered substantially during 2025 |
| 6 | 2015–16 correction, continuing into 2016 | 9,119 (Mar 2015) | 6,826 (Feb 2016) | ~−25% | China concerns, commodity/oil weakness and global risk aversion | ~14 months |
| 7 | 2023 banking/Adani-related correction | ~18,812 (Dec 2022) | ~16,828 (Mar 2023) | ~−10.5% | Adani-related volatility, global banking stress and rate concerns | ~9 months |
| 8 | 2019 correction | ~12,103 (Jun 2019) | ~10,637 (Aug 2019) | ~−12% | Growth slowdown, corporate/financial-sector concerns and global trade tensions | Subsequently recovered |
| 9 | 2024 election-day shock | ~23,264 (Jun 3, 2024) | ~21,281 intraday (Jun 4) | ~−8.5% intraday | Unexpectedly close election-result outcome versus market expectations | Within days on a closing basis; new records followed |
| 10 | 2016 Brexit correction | ~8,266 (Jun 23) | ~7,893 (Jun 24) | ~−4.5% | UK Brexit referendum and global risk aversion | Rapid recovery |
*The exact peak-to-trough definition can produce different numbers depending on whether closing or intraday prices are used. Nifty historical-data sources distinguish between these measures.
Important correction to the table
There is an important distinction between a crash, a correction, and a single-day shock. For example, the June 4, 2024 election-result event was an exceptionally large one-day fall: Nifty closed down 5.93%, while its intraday fall reached about 8.5%. The indices recovered to record levels soon afterward.
The 2020 COVID episode is much clearer as a genuine crash: NISM records Nifty falling from 12,430 in January 2020 to 7,511 in March 2020, a 39.57% decline, with 246 days to regain the previous peak.
For the longer 2021–23 cycle, one useful drawdown dataset identifies a roughly 26% peak-to-trough decline from October 15, 2021 to March 15, 2023, with the previous peak recovered on June 27, 2024.
The 2024–25 decline was also significant. NSE reported that Nifty had fallen 15.6% from its September 2024 peak by February 28, 2025, after five consecutive monthly declines.
🌍 World Top 10 Best-Selling Cars in 2025
| Rank | Car Model | 2025 Global Sales | Approx. Price* | Mileage / Range | Fuel / Powertrain | Safety | Key Features |
|---|---|---|---|---|---|---|---|
| 1 | Tesla Model Y | ~1.20 million | ~$44,990+ | ~500–600 km** | Electric | 5-star Euro NCAP / NHTSA-tested market variants | Long range, advanced driver assistance, minimalist interior, large touchscreen |
| 2 | Toyota RAV4 | ~1.00 million | ~$30,000+ | ~14–22 km/L*** | Petrol / Hybrid / PHEV | 5-star ratings in major markets/variants | Hybrid options, AWD, Toyota Safety Sense, spacious SUV |
| 3 | Toyota Corolla | ~0.98 million | ~$23,000+ | ~18–23 km/L*** | Petrol / Hybrid | 5-star ratings in several markets/variants | Hybrid efficiency, reliability, ADAS, connected technology |
| 4 | Ford F-Series | ~0.97 million | ~$38,000+ | ~7–12 km/L*** | Petrol / Hybrid | 5-star ratings for tested configurations | High towing capacity, large cabin, Pro Power Onboard, advanced driver assistance |
| 5 | Honda CR-V | ~0.72 million | ~$30,000+ | ~14–18 km/L*** | Petrol / Hybrid | 5-star ratings in major markets/variants | Hybrid option, Honda Sensing, spacious interior, AWD |
| 6 | Chevrolet Silverado | ~0.67 million | ~$38,000+ | ~7–11 km/L*** | Petrol / Diesel / EV | Rating varies by configuration | High towing capability, large cargo bed, advanced infotainment |
| 7 | Hyundai Tucson | ~0.63 million | ~$28,000+ | ~13–18 km/L*** | Petrol / Hybrid / PHEV | 5-star ratings in several markets/variants | ADAS, hybrid options, large touchscreen, connected services |
| 8 | Toyota Camry | ~0.63 million | ~$29,000+ | ~18–23 km/L*** | Hybrid | 5-star ratings in major markets | Hybrid powertrain, Toyota Safety Sense, comfortable cabin |
| 9 | Volkswagen Tiguan | ~0.55 million | ~$30,000+ | ~14–20 km/L*** | Petrol / Diesel / Hybrid/PHEV | 5-star Euro NCAP for tested generation | Digital cockpit, IQ.DRIVE, PHEV option, spacious cabin |
| 10 | Kia Sportage | ~0.55 million | ~$28,000+ | ~13–18 km/L*** | Petrol / Diesel / Hybrid | 5-star ratings in major markets/variants | Dual displays, ADAS, hybrid options, panoramic features |
📊 Global sales at a glance
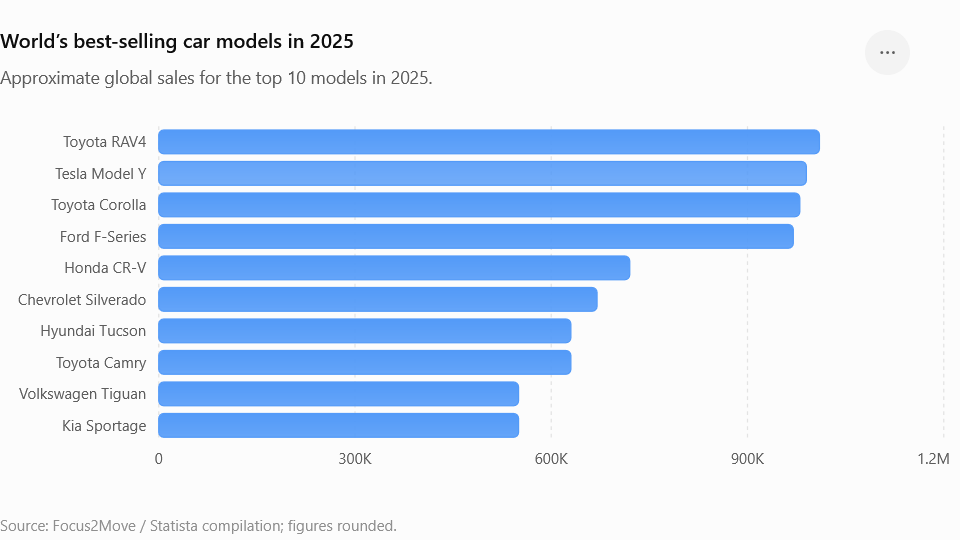
The 2025 dataset puts the leading models at approximately 1.01 million RAV4, 0.99 million Model Y, 0.98 million Corolla, 0.97 million F-Series, 0.72 million CR-V, 0.67 million Silverado, 0.63 million Tucson, 0.63 million Camry, 0.55 million Tiguan and 0.55 million Sportage.
🚗 India’s Top 10 Best-Selling Cars — August 2026
| Rank | Car | Aug. 2026 Sales | Ex-showroom Price* | Mileage** | Fuel | Safety rating*** | Key features |
|---|---|---|---|---|---|---|---|
| 1 | Tata Punch | 21,320 | ₹5.75–10.77 lakh | Up to ~26 km/kg | Petrol/CNG/EV | ⭐⭐⭐⭐⭐ BNCAP | 6 airbags, touchscreen, connected features, automatic climate control |
| 2 | Maruti Suzuki Wagon R | 20,180 | ₹4.99–7.24 lakh | 20.5–33.5 km/kg | Petrol/CNG | Crash-test rating varies by test | Spacious cabin, 7-inch touchscreen, Android Auto/Apple CarPlay |
| 3 | Maruti Suzuki Swift | 19,832 | ₹5.84–8.74 lakh | Up to ~25.8 km/kg | Petrol/CNG | Crash-test rating varies by test | 6 airbags, ESP, touchscreen, wireless charger, cruise control |
| 4 | Maruti Suzuki Fronx | 18,730 | ₹6.85–11.84 lakh | 20.0–28.5 km/kg | Petrol/CNG | Rating depends on test/market | SUV styling, turbo-petrol option, touchscreen, connected features |
| 5 | Maruti Suzuki Ertiga | 18,516 | ₹8.90–13.04 lakh | 20.3–26.1 km/kg | Petrol/CNG | Rating depends on test | 7 seats, 3-row cabin, automatic option, cruise control |
| 6 | Tata Nexon | 18,431 | ₹7.40–14.52 lakh | Varies by powertrain | Petrol/Diesel/CNG/EV | ⭐⭐⭐⭐⭐ BNCAP | 6 airbags, touchscreen, connected tech, multiple powertrains |
| 7 | Maruti Suzuki Dzire | 18,418 | ₹6.31–9.41 lakh | Up to ~25.7 km/kg | Petrol/CNG | ⭐⭐⭐⭐⭐ BNCAP | 6 airbags, ESP, touchscreen, sunroof, cruise control |
| 8 | Hyundai Creta | 16,288 | ₹10.91–20.11 lakh | Varies by engine | Petrol/Diesel | ⭐⭐⭐⭐⭐ BNCAP* | ADAS, panoramic sunroof, connected technology, premium cabin |
| 9 | Maruti Suzuki Baleno | 15,746 | ₹5.99–9.99 lakh | Up to ~22.9 km/kg | Petrol/CNG | BNCAP rating varies by variant | Head-up display, touchscreen, 360° camera, connected features |
| 10 | Mahindra Scorpio | 15,576 | ₹13.69–25.49 lakh | Varies by engine | Petrol/Diesel | Scorpio-N tested separately | Strong SUV design, 4WD option, touchscreen, 6/7-seat configurations |
* Prices are approximate ex-showroom prices and can change by variant, location and manufacturer updates.
** Mileage depends on engine, transmission and fuel type; actual mileage varies with driving conditions.
*** Safety ratings should always be associated with the specific tested variant and crash-test programme rather than assumed for every variant.
Numerology के नजरिए से Analog vs Digital Watch
Numerology के नजरिए से Analog vs Digital Watch
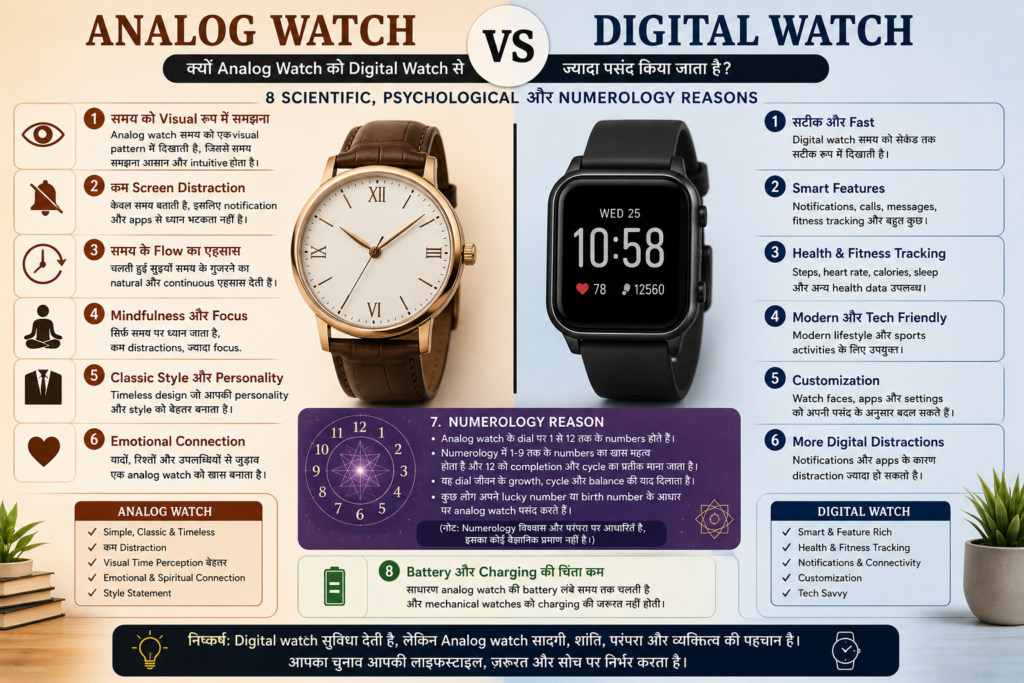
Analog watch में समय की सुइयाँ लगातार घूमती रहती हैं। Numerology में गोलाकार गति को continuity, balance और life-cycle का प्रतीक माना जाता है। इसलिए कुछ numerology मान्यताओं में analog watch को व्यक्ति की stability, patience और balanced energy से जोड़ा जाता है।
वहीं digital watch समय को सीधे numbers में दिखाती है—जैसे 10:10, 11:11, 12:12। Numerology में numbers को symbolic energy से जोड़कर देखा जाता है। खासकर 11:11 जैसे repeating numbers को कई लोग intuition, new beginnings या manifestation का संकेत मानते हैं।
एक दिलचस्प फर्क:
⌚ Analog = समय का flow और balance
⌚ Digital = समय की exactness और numbers की energy
उदाहरण के लिए, analog watch में 10:10 की स्थिति visually balanced दिखाई देती है। इसी कारण watches में 10:10 display को aesthetically pleasing माना जाता है। Numerology की मान्यताओं में भी 1 और 0 को नए आरंभ और potential से जोड़कर देखा जाता है—हालाँकि इसका वैज्ञानिक प्रमाण नहीं है।
इसलिए अगर आप numerology में विश्वास करते हैं, तो analog watch को continuous growth और balance का प्रतीक और digital watch को precision, numbers और specific numerical patterns का प्रतीक मान सकते हैं।